We care about extreme weather events because of their destructive impact. For instance in July 2021, rain-fed floods swept through Germany, Belgium, Luxembourg, and the Netherlands. Two days of severe rainfall from an almost stationary storm, on top of already wet soils, caused rivers to overflow and triggered flash floods and landslides in the mountainous regions. More than 200 lives were lost, and economic damages exceeded €6 billion (Kreienkamp et al., 2021).

Photo by Joop van Houdt, licensed under CC BY-SA 4.0, via Wikimedia Commons.
A few months later, on December 10th, 2021, eight U.S. states were struck by one of the most severe tornado outbreaks on record. NOAA confirmed 61 tornadoes in one night, ranging from EF-1 to EF-4 intensity. Over 80 people were killed, and damages reached up to millions of dollars (Pirtle, 2021).

Photo by Copernicus Emergency Management Service, licensed under CC BY 4.0, via Wikimedia Commons.
The 2019 European heatwaves were a striking event, breaking temperature records across countries like Belgium, France, Germany, Luxembourg, the Netherlands, and the UK. In parts of the Netherlands, Belgium, and Germany, temperatures soared past 40°C. The first heatwave in June was caused by hot air moving up from North Africa, which dried out the soil and made the July heatwave even more intense(Sousa et al., 2020). These extreme conditions had serious consequences: approximately 2,500 extra deaths, damage to infrastructure, wildfires, and major crop losses (Bastos et al., 2021; Vautard et al., 2020).
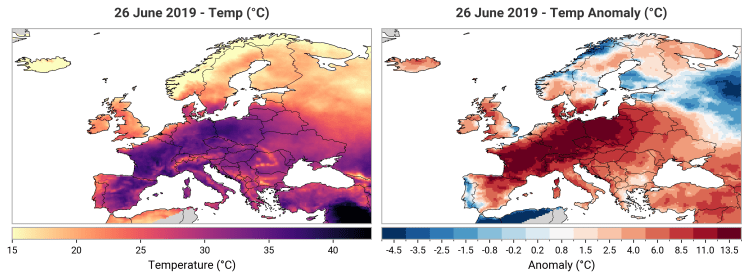
Right: Temperature anomalies for the same day, showing how much hotter it was compared to the 1981–2000 average. Parts of France, Germany, and Poland experienced temperatures up to 14°C above normal.
Made by Linda van Garderen | E-OBS data | Download python code
The global climate is warming, mainly because of rising greenhouse gas levels (IPCC, 2021). Understanding how climate change influences extreme weather is essential to better predict future risks and lessen their impacts. But what exactly do we mean when we talk about an ‘extreme weather event’?
Defining Extreme Weather Events
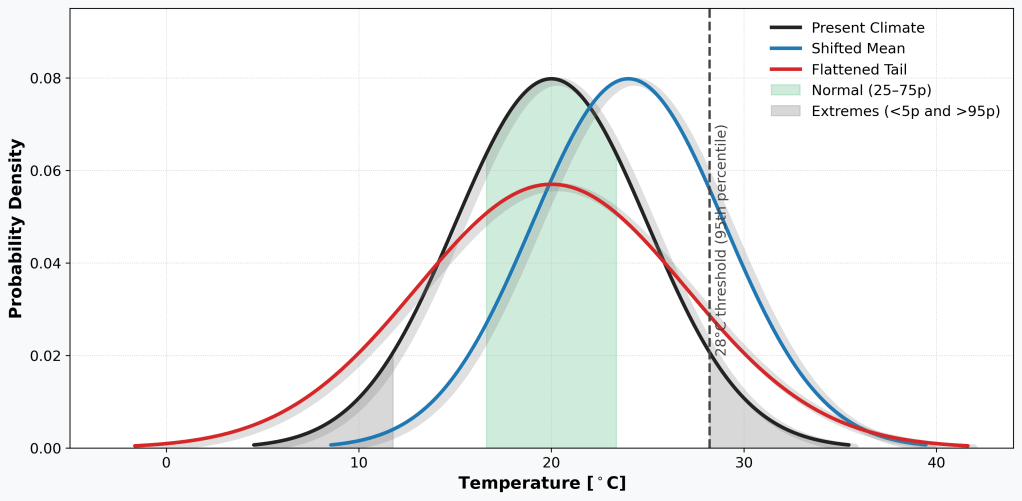
Graph by Linda van Garderen – Download python code
When weather data are tracked over a long period—typically 30 years or more—we get to calculate the average and some other statistical variables. This is called a climatology. For instance, the black line in the graph above shows a distribution of daily average temperatures where around 20°C is most common, while very low or very high temperatures occur much less frequently. The green shaded area we would call ‘normal’ since those temperatures are very common. The grey shaded area— daily temperatures falling below the 5th percentile or above the 95th percentile of the distribution—are defined as meteorological extreme events.
Climate change can affect these distributions in several ways. It might shift the entire curve toward higher temperatures (blue line) causing more warmer and less cooler days, or it might stretch out the tails. (red line), meaning both hotter and colder extremes become more likely. In both cases, events that were once rare may become more frequent (Otto, 2017).
For example, a temperature of 28°C might have been a rare, extreme value in a past climate but in a changed climate may occur much more often (vertical black dotted line) and no longer part of what is extreme. The exact way these changes unfold depends on the region and on the variable—temperature, rainfall, wind, etc.
There is a twist to the story, though. Not every ‘extreme weather event’ – such as temperature above the 95th percentile – may be perceived as an extreme event. Geographic factors, land use, infrastructure, and the vulnerability of local populations all play a role. If there is a meteorological drought, but the agricultural lands have well-function irrigation at hand, the impact will be much lower than without such adaptation strategies. As such, not all high-impact events stem from highly unusual weather (van der Wiel et al., 2020).
References
Kreienkamp et al., 2021: Rapid attribution of heavy rainfall events leading to the severe flooding in Western Europe in July 2021. ↑
Pirtle, 2021: NOAA statement on December 2021 tornado outbreak. ↑
Sousa et al., 2020: Dynamics of the June–July 2019 European heatwaves. ↑
Bastos et al., 2021: Impacts of 2019 European heatwaves on ecosystems and human health. ↑
Vautard et al., 2020: Human contribution to the record-breaking June and July 2019 heatwaves in Western Europe. ↑
IPCC, 2021: Sixth Assessment Report – Summary for Policymakers. ↑
Otto, 2017: Attribution of extreme weather events in the context of climate change. ↑
van der Wiel et al., 2020: Impact-based classification of extreme events and their underlying drivers. ↑

.jpg)
.jpg)